Configuration
Connection for Remote Port Status Monitor
Using
Remote Port Status Monitor
Overview
The Connection Remote Port Status Monitor (or just RPSM) is
a Windows based application that serves as a real time conversation state
monitor for Connection 2.1(1) and later servers.

Once you’ve configured Connection to output port information (see the next section) you can open the Remote Port Status Monitor, point it at the Connection server and begin monitoring the server you choose. The last IP/server name you enter is remembered for future use. If you receive an error during connection make sure the IP address is correct and that Connection is configured to output monitor information and accept connections from the IP address of the client machine you’re running rPSM on. (see the Configuring Connection for Remote Port Status Monitor)
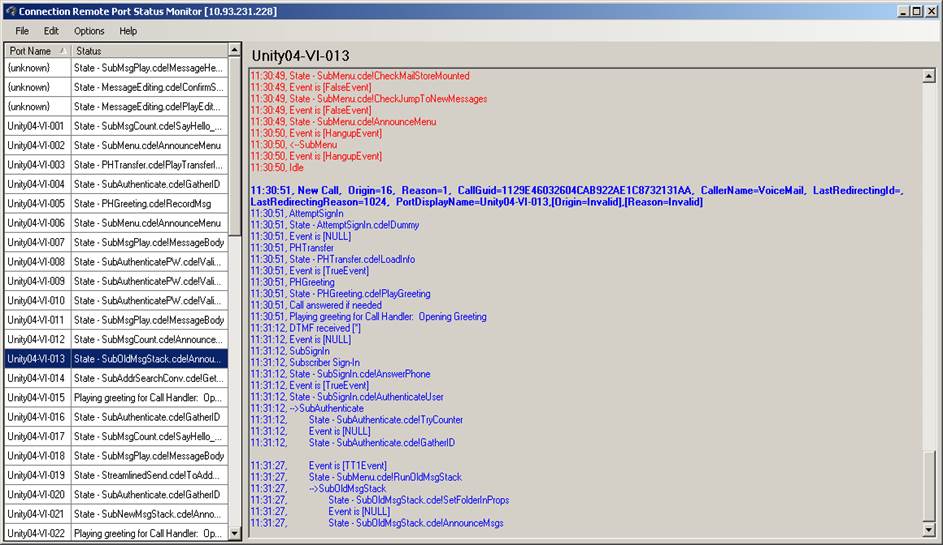
As shown in the shot above each new call coming into a port will log in a different color, alternating between red and blue. Each call starts with a bold line that indicates the calling number, dialed number, redirecting ID, origin and reason for the call.
Since CUC Remote PSM does not know how many active ports are installed on the Connection server (it only reads output Connection – it makes no DB or other file connection to the server), the port list on the left is populated with data as calls come in. Once a call is handled on that port it’s current status is updated real time and will be “idle” after the call terminates. Up to 512 ports can be handled by CUC Remote PSM.
The Port names will show up only when a new call starts on a port. If call data is being received for ports that have not yet had a new call on them the port name is listed as “{unknown}” as shown above. Once a new call comes in on one of those ports the port name will be updated. You can sort the port name column by clicking on it.
Requirements/Special Notes
This application runs on Windows XP/2000/2003 or
This application requires .NET framework 2.0 or better. The install will detect if this needs to be installed and launch the setup automatically if it’s missing.
This application only works with Unity Connection 2.1(1) or later.
You must enable the port status monitor output and setup the client machine you’re running this application on to allow the remote port status monitor tool to connect. See the next section for more on that.
Configuration
Connection for Remote
Port
For
Connection 7.0(1) and later
For Connection 7.0(1) and later you need to two do things in the “Conversation” section in the Advanced Settings in the administration interface before the rPSM will work properly.
- Turn on the remote port status monitor output. This is a checkbox titled “Enable Remote Port Status Monitor Output”
- Add the IP address into the list of addresses that are allowed to monitor output. This is a comma separated list in the advanced setting section titled “IP Addresses Allowed to Connect for Port Status Monitor Output”. You can have over 100 addresses in this list if desired.
The two settings should look something like this:

If you get a dialog message indicating an error connecting when you run rPSM, likely you don’t have the IP address of the machine you’re running from included in the list.
For
Connection 2.1(1)
In Connection 2.1(1) and later you can simply turn on the advanced setting option found in the web administration interface under System Settings | Advanced | Conversations | Enable Remote Port Status Output. With this option checked, all new calls that come in will output information that the remote port status monitor can show. Connection 2.1 did not require each connecting client IP address be listed as 7.0 and later does.
Note: Connection 2.1(1) does not send the port name with the incoming call data as Connection 7.x does.
For
Connection 2.0(1)
Using
Remote
Port
Options
and Features
Edit Menu
The edit menu has the usual suspect for selecting all text in the currently visible port output, copying it to the clipboard, clearing it (F1) or clearing all port output (F2), but the most interesting item here is the search option (CTRL-F). When you select to search a floating dialog comes up that looks reasonably familiar
By default it’ll search across all port output so when you hit “Find Next” and you’re at the bottom of a current port output window, it’ll automatically go to the next available port output window, looping back around until you get to the original output port you started that particular search on. If you would prefer to limit the output to only the currently visible port output then select the “Search selected port output only” checkbox.
NOTE: When searching text in the port output with incoming calls to the system, it’s best to use the “Pause auto scrolling” option under the Options menu to keep the text you’re looking at from moving off the screen automatically.
Options Menu
The options menu gives you control over a number of display and output options for RPSM.
Pause auto scrolling
Off by default. As new information comes in for each port, the display is automatically updated and moved to show the most recent information – “scrolling” to the bottom of the output in other words. In cases where you wish to review some output without having this happen, select this option. All port outputs will stop automatically scrolling to the bottom but new data will continue to be appended to the ends of the outputs anyway. This is especially helpful when using the search option noted above.
Pause all Updates
Off by default. This option stops updating all port information entirely across the boards. If you are logging information to a file, that will continue to happen, however no display information will be updated. This option should only be used under very specific circumstances since the display information is essentially lost while you have this paused. The title of the application will indicate “** PAUSED **” to help remind you that you are in an information “blackout” while this is on.
Log all output to file
Off by default. If you would like RPSM to write all information it’s getting from port 5000 on the remote Connection server to a local file, you can use this option to do it. The data is logged exactly as it’s received on the port with the addition of a timestamp in front of each line. The output is not affected by the pause option noted above or the trace data output options also noted above.
The output is logged to an automatically generated file under the \LogOutput\ folder where RPSM is installed. Note that these files are not automatically aged or cycled and once you turn the output on, it will continue logging to that fie until you exit the application or unselect this option.
View log folder
This option opens File Explorer to the \LogOutput\ folder where the logging function noted above creates its output files.
View
Raw Port
Checking this option will show a new dialog that displays the unformatted and unparsed output received directly from the Connection port. It’s used for diagnostic purposes.
Including Prompt Data In Output
Remote Port Status Monitor version 2.0(3) and later supports the option of looking up prompt text and including it in the output if you have Connection configured to output prompt file names to the monitor. To include prompt information in the output you need to turn on two traces in Connection’s micro trace interface:
PhraseServer -05 (Phrase IDs)
PhraseServer 06 (Prompt file names and audio stream info)
PhraseServerToMonitor -05 (Phrase IDs)
PhraseServerToMonitor 06 (Prompt file names and audio stream info)
With those traces turned on you’ll see the names of prompts included in the output as they play. rPSM will lookup the full prompt text for that prompt and show it directly underneath the prompt name in the output.
NOTE: This only displays text properly for single byte character names (i.e. English, French, German, Spanish etc…). Double byte language characters do not display properly at this time – this includes Japanese, Arabic and Chinese most notably.
Gathering Trace Data and
Utterances for a Call
If you have root access to the Connection server you can use the call information gathering capabilities of RPSM to pull all the data, diagnostic and voice utterance files related to a call onto your local Windows box quickly and easily. If you do not have root access to the server this function will fail. This function is targeted at development engineers, testers and TAC folks to help with quickly diagnosing problems with Connection.
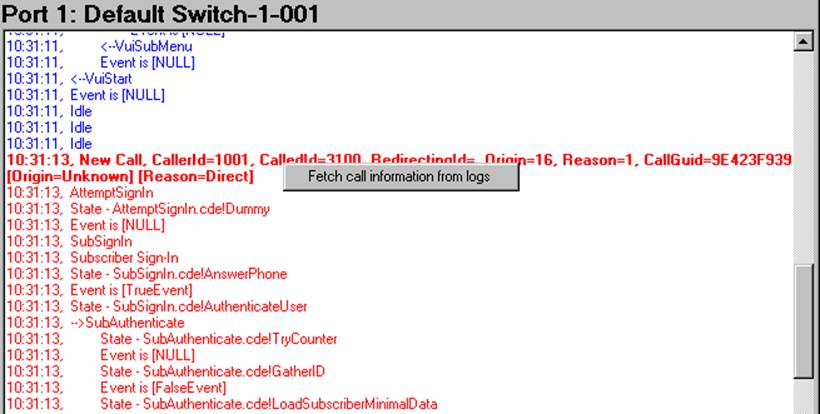
To gather diagnostic information about a call, simply right click on any call’s first line in the output – this line is bold and includes all the information about the inbound call including it’s call GUID value. A popup dialog will appear offering the option to fetch call information when you do this as shown in this screen shot:

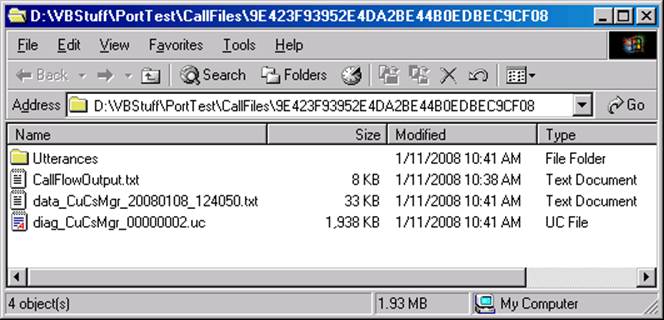
If you select this option RPSM will attempt to log into the Connection server you’re currently monitoring using root credentials. If it succeeds you will see it connecting, gathering and then copying log files. When its done you’ll get an option to view the output folder where you’ll find all the files related to the call - diagnostic, data text files and any WAV file utterances if you have Connection diagnostic settings to have those saved by the speech engine:

The Utterances folder in the above shot contains all the WAV files that contain the user’s spoken voice commands during the entire call – these files will be referenced in the VUI 5 trace output in the logs.
NOTE: The wav file utterance capturing diagnostic is available only in Connection 7.0(1) and later.
Obtaining Updates
To check for updates to this tool, visit http://www.CiscoUnityTools.com or you can use the “Check for updated versions” link found in the About dialog box of this application.
Revision
History
Version 2.0.0.24 – 6/22/2015
· Updated port name fetching logic to handle new fields in 10.5
Version 2.0.0.23 – 5/4/2015
· Updated file compaction library with newer Chilkat libraries for 64 bit os installs
· Updated Chilkat libraries in file fetching routines (for debug mode)
· Updated setup package to latest build of qSetup.
Version 2.0.0.20 – 12/23/2014
· Updated Chilkat SSH and SFTP libraries
· Increased login timeouts via SSH and SFTP
Version 2.0.0.18 – 12/8/2014
· Updated setup for Windows 8.1 x32 and x64 and Server 2012R2 x64 support
Version 2.0.0.17 – 11/10/2012
· Updated to .NET 4.0 framework.
· Updated setup to handle Windows 8 installs.
Version 2.0.0.16 - 5/28/2011
· Fixed problem with forwarding and origin reason parsing across versions of Connection
Version 2.0.0.15 – 3/26/2011
· Simplified the interface for gathering diagnostics and utterance files related to a call with root access – there is no more diagnostic grid display and the functionality now uses the built in ChilKat SFTP/SSH libraries instead of the external BlackBox file tracker libraries.
Version 2.0.0.14 – 3/10/2011
· Updated prompts database for the 8.5 release train.
Version 2.0.0.12 – 12/14/2010
· Updated the prompt text database with new strings from the latest 8.0 release.
Version 2.0.0.11 – 11/16/2010
· Updated setup to include some missing DLLs for file gathering app.
Version 2.0.0.10 – 10/23/2010
· Updated the call file gathering routine to handle the new VUI utterance diagnostic output for file path references for the Connection 8.5 release.
Version 2.0.0.9 – 8/8/2010
· Consolidated setups into one install for 32 and 64 bit os installations.
· Updated error handling logic around prompt name/text lookup routines when diagnostic output for WAV file paths is included in the output.
Version 2.0.0.8 – 7/14/2010
· Changed setup framework to qSetup.
· Fixed dependency issues for Windows 7 and Vista installations
Version 2.0.0.7 – 2/2/2010
- Fixed an issue with the first inbound call processing when attaching to Connection 2.x based systems.
- Fixed a problem with first call line parsing that was leaving the caller/called ID out of the formatted output.
- Added logic to force the port names to be the port Id when names are not sent across the output (for 2.x based systems).
Version 2.0.0.5 – 1/6/2010
- Release for Connection 8.0 product line
© 2011 Cisco Systems, Inc. -- Company Confidential